Beacon node metrics
The Prysm beacon node exposes Prometheus metrics out of the box at http://127.0.0.1:8080/metrics. Point any Prometheus server at this endpoint to scrape them.
Flags
| Flag | Default | Use it to |
|---|---|---|
--monitoring-host | 127.0.0.1 | Choose the address the metrics are served on. Use 0.0.0.0 only if Prometheus runs on another machine, and firewall the port. |
--monitoring-port | 8080 | Choose the port the metrics are served on. |
--disable-monitoring | off | Stop serving metrics. |
Check that the beacon node responds:
curl -s http://127.0.0.1:8080/metrics | grep '^beacon_finalized_epoch'
Grafana dashboard
Download the beacon node dashboard and import it into Grafana 13 or later, with your Prometheus as the data source. It only uses metrics the beacon node exposes.
Name the Prometheus scrape job beacon: the system and replay panels filter on job="beacon".
Summary
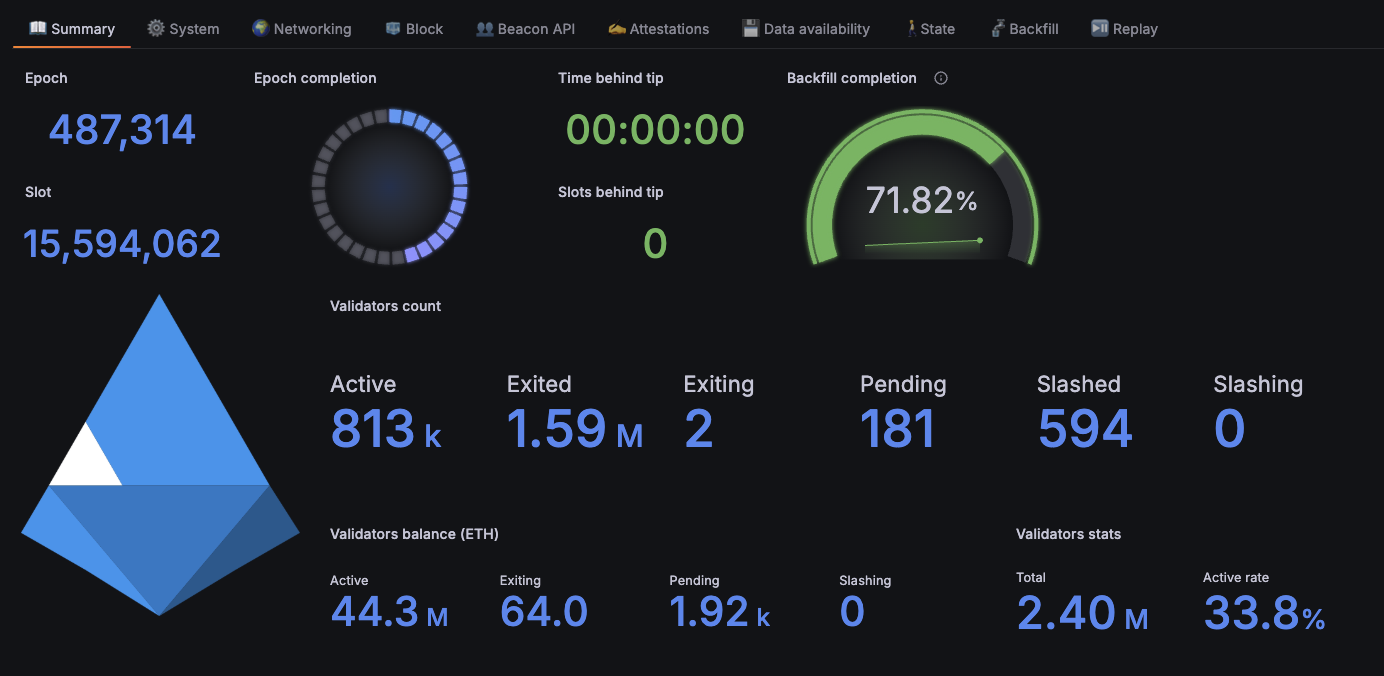
Current epoch and slot, how far the node is behind the chain head, backfill progress, and validator counts and balances across the whole network.
System
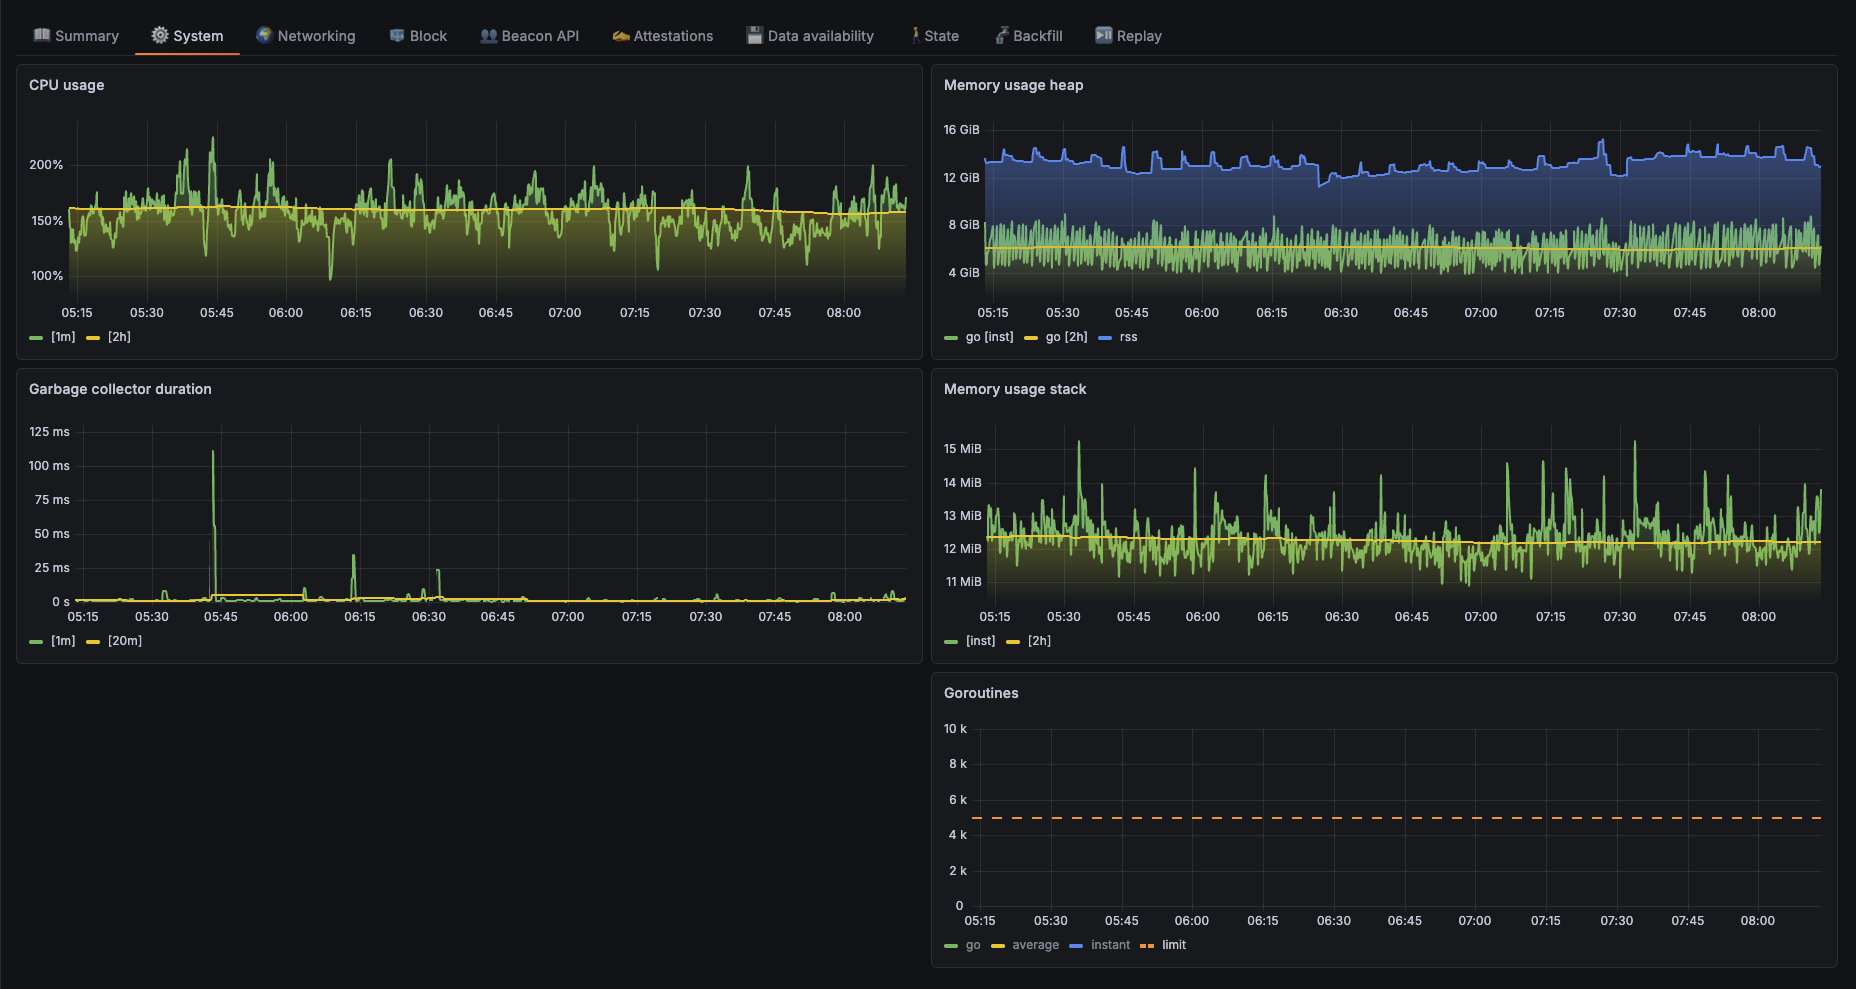
CPU, heap and stack memory, garbage collection time, and goroutines of the beacon node process.
Networking
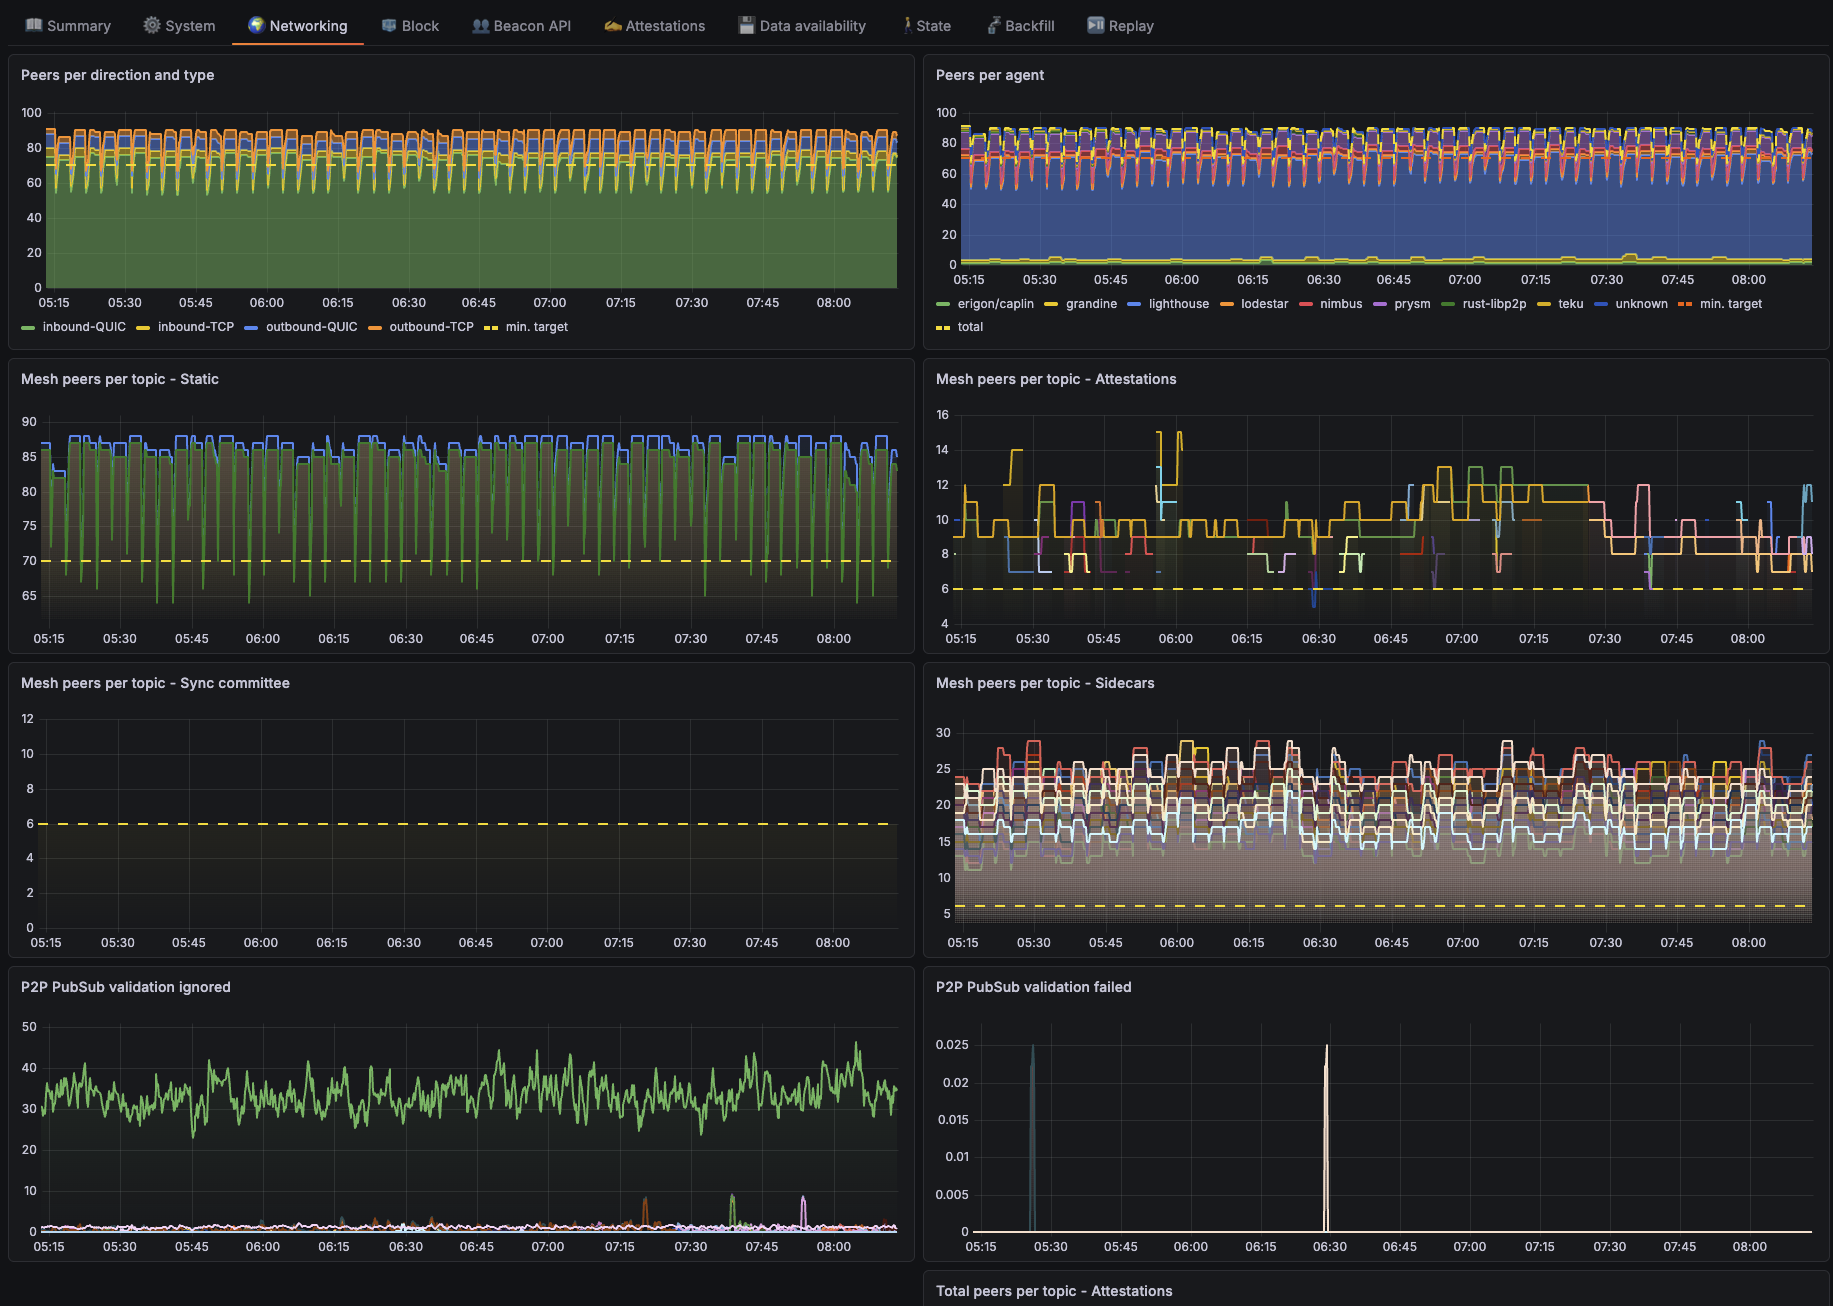
Peers by direction, transport, and client; mesh peers per gossip topic against their targets; and gossip messages ignored or rejected.
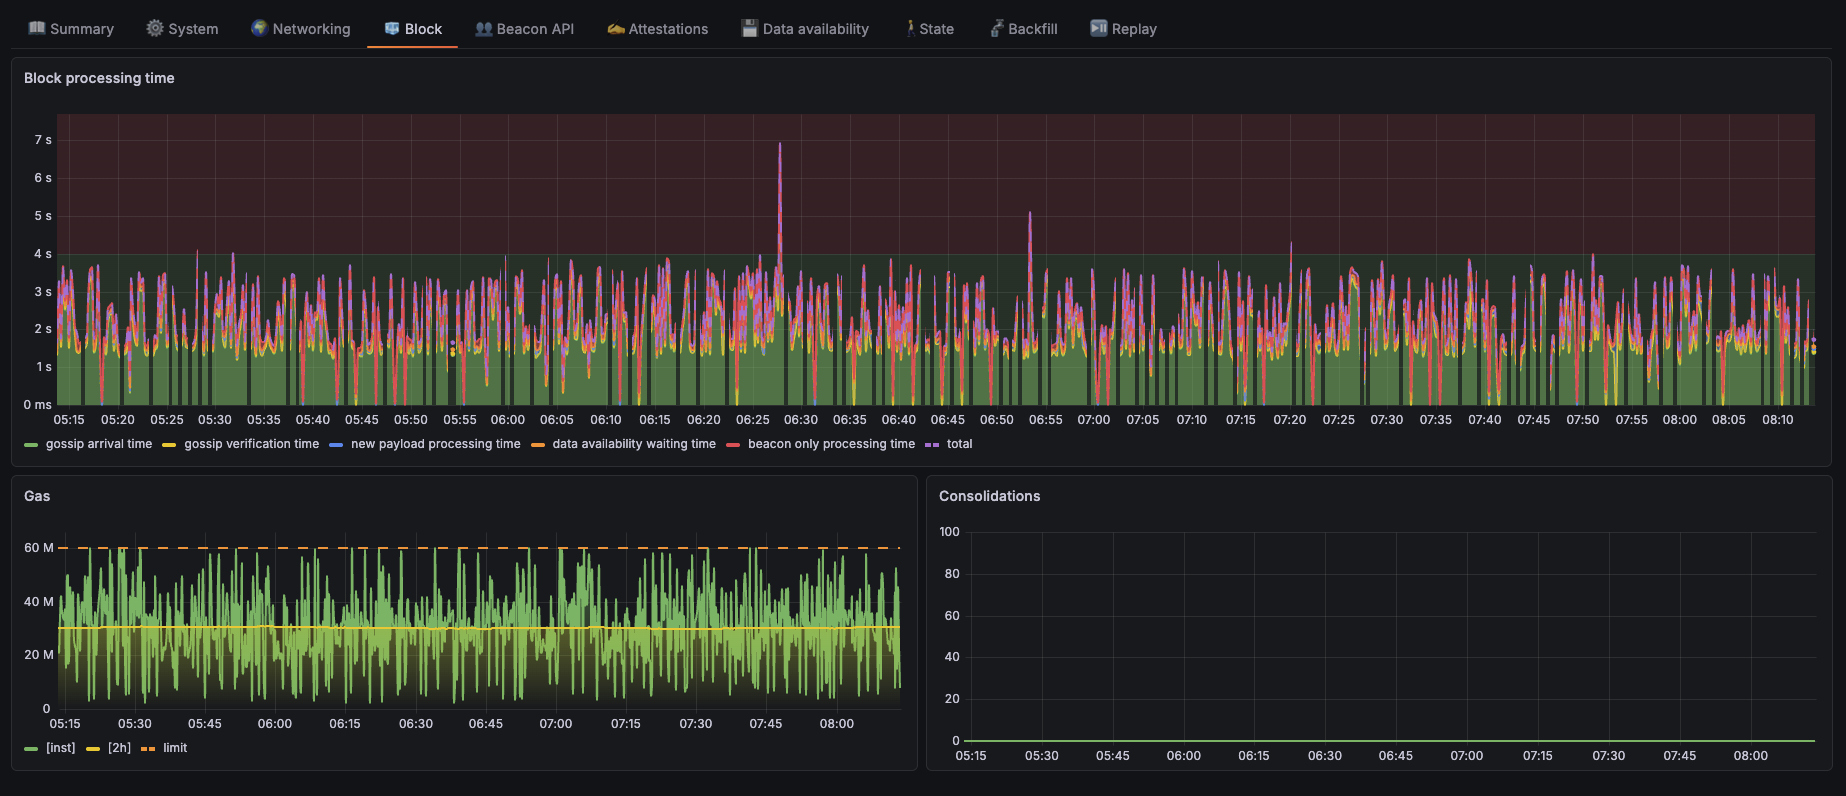
Block
Time to process each new block, split into gossip arrival, verification, execution payload, data availability and beacon processing, plus gas used and consolidation requests.
Beacon API
Rate of validator API requests to the beacon node, by endpoint and by response class (2xx, 4xx, 5xx).

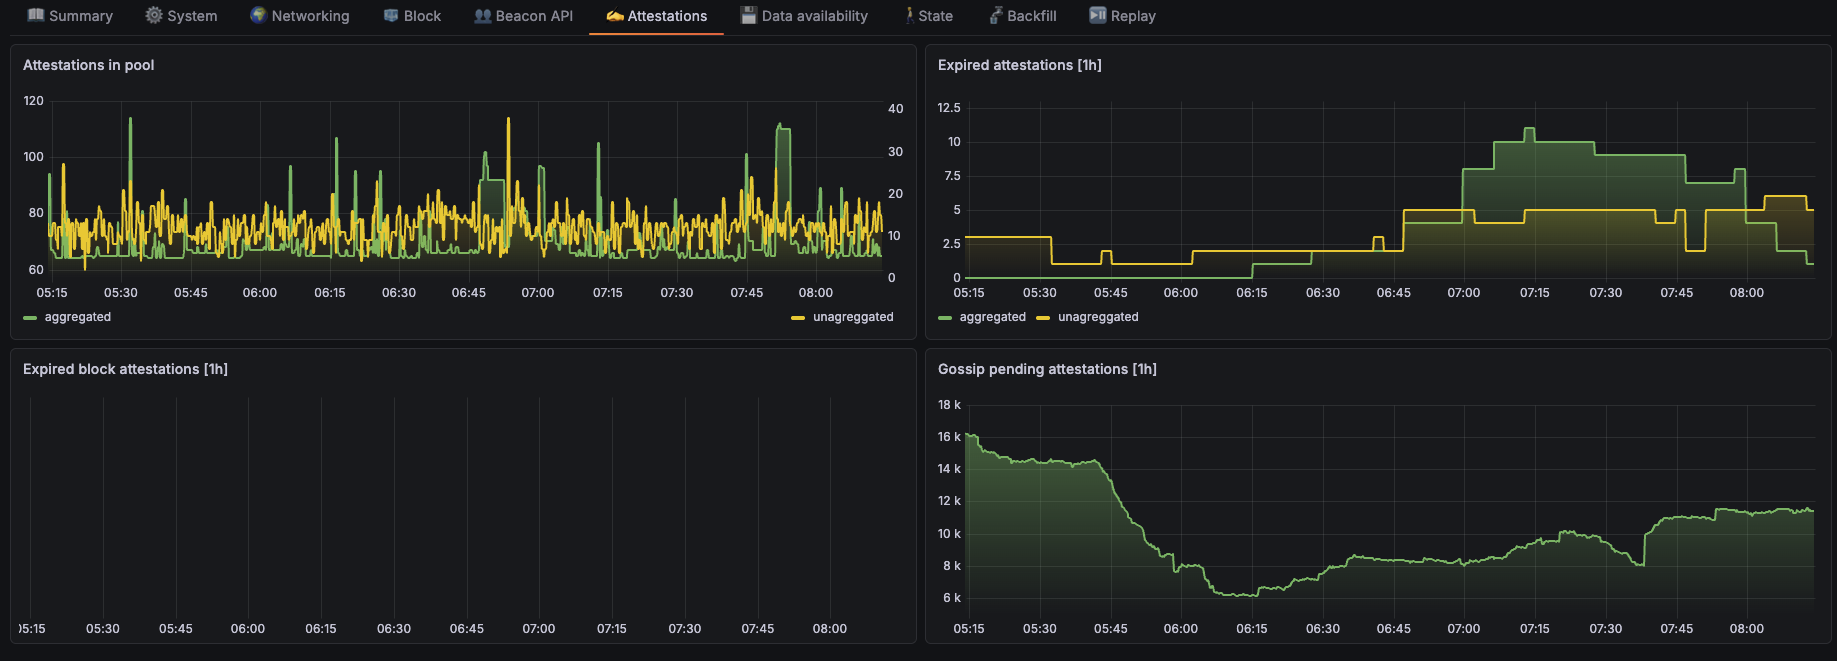
Attestations
Attestations waiting in the pool, attestations that expired before being used, and attestations pending on gossip.
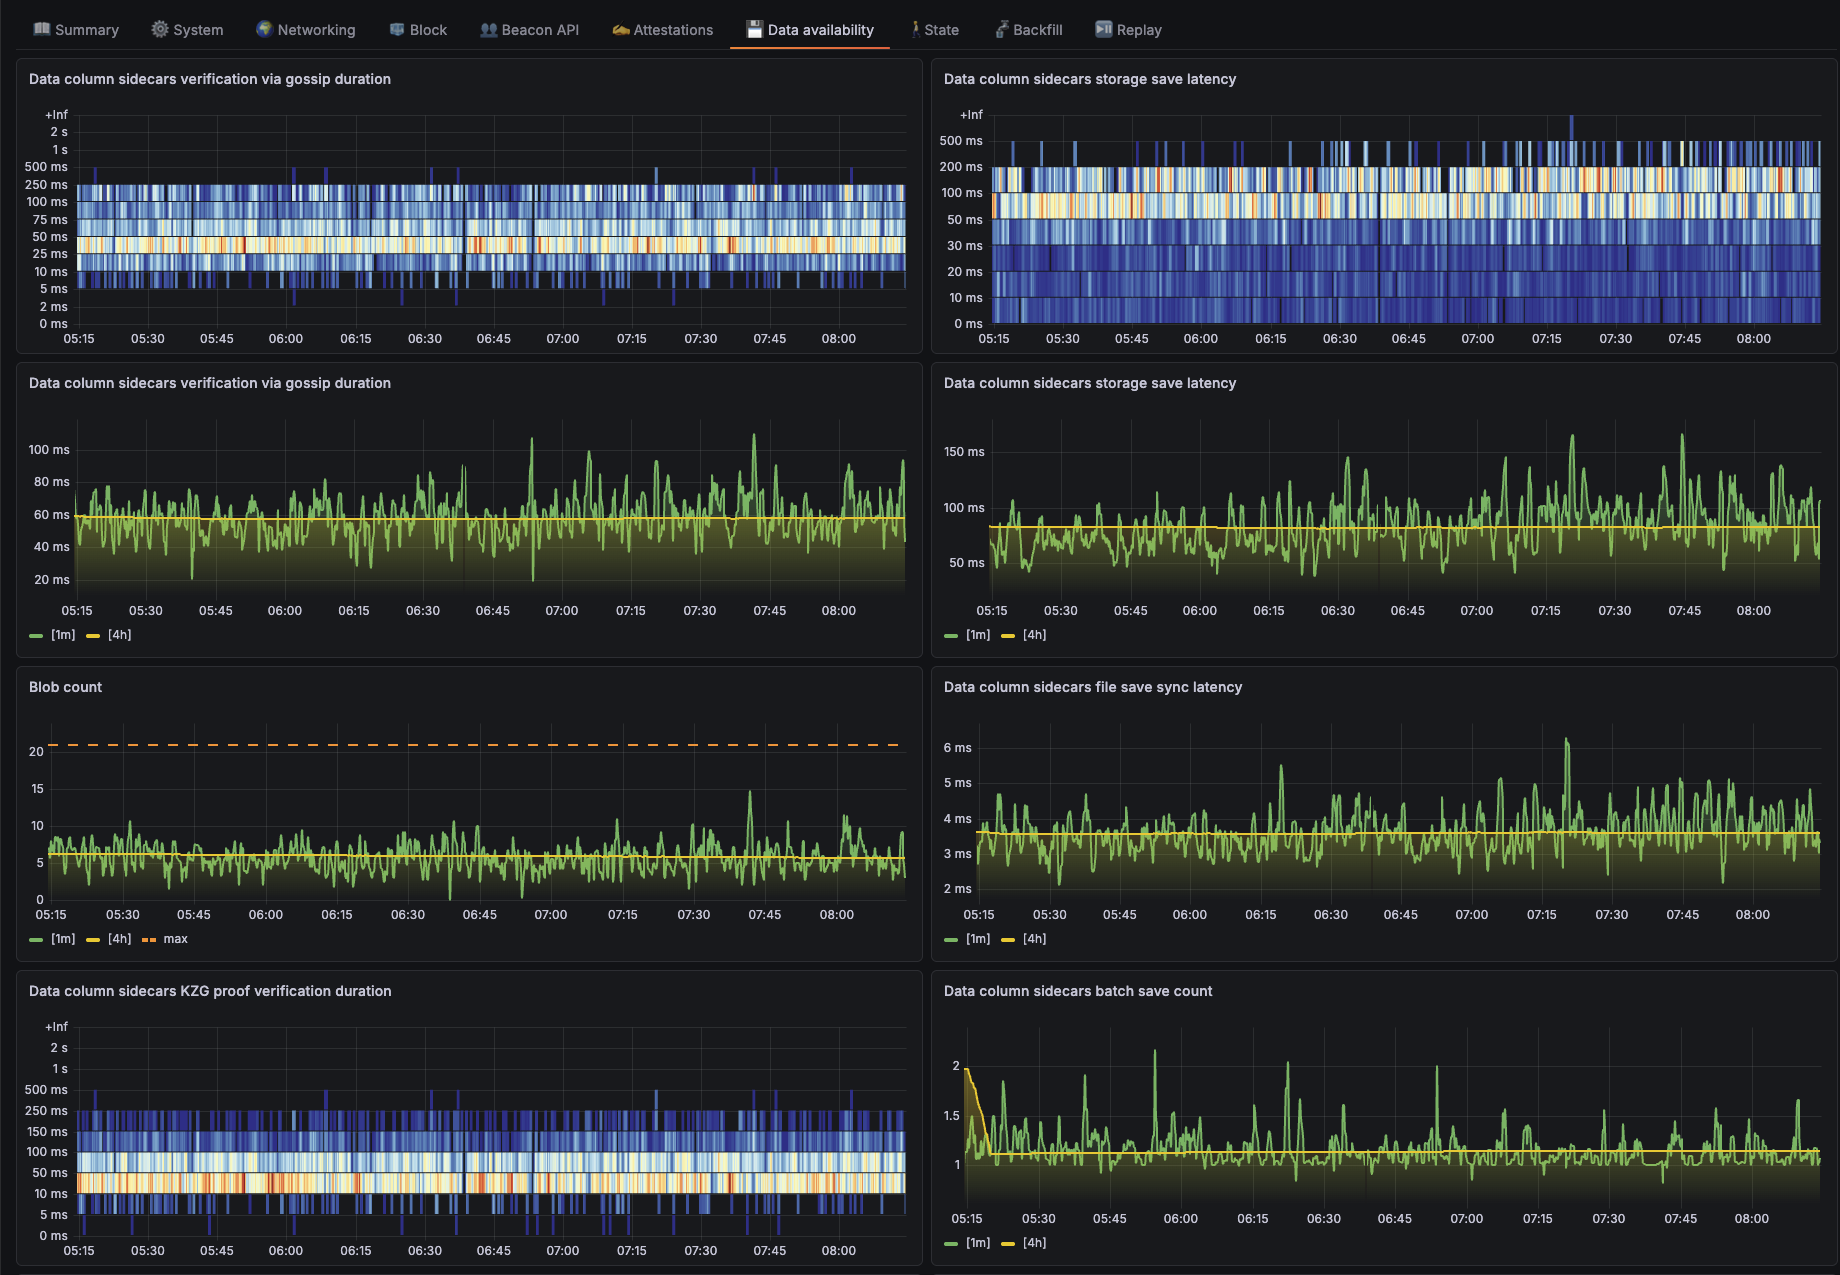
Data availability
Verification, KZG proof and storage times for data column sidecars, blob count per block, and getBlobsV2 latency.
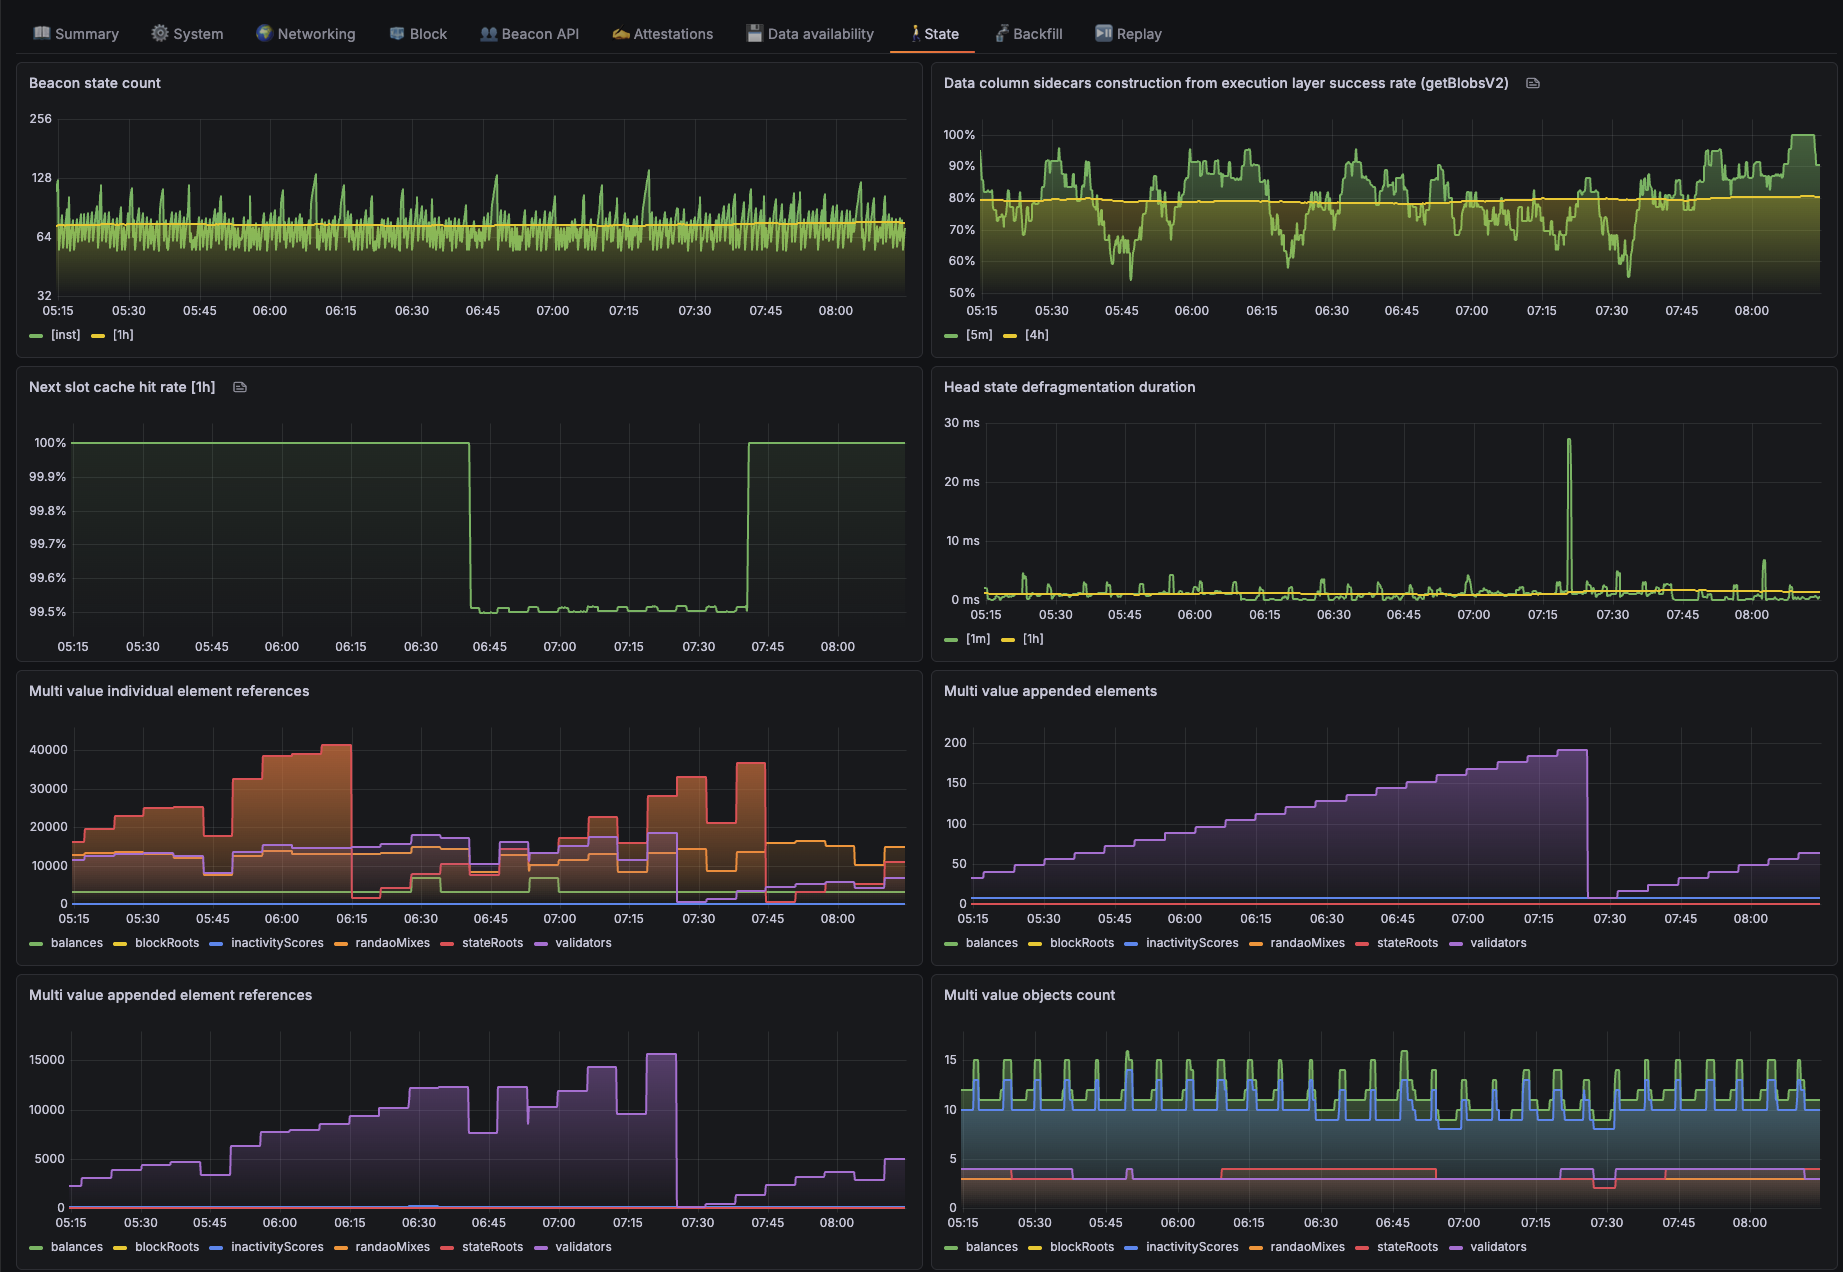
State
Beacon state count, state cache hit rates, head state defragmentation, and internal state memory structures (multi-value slices, field tries).
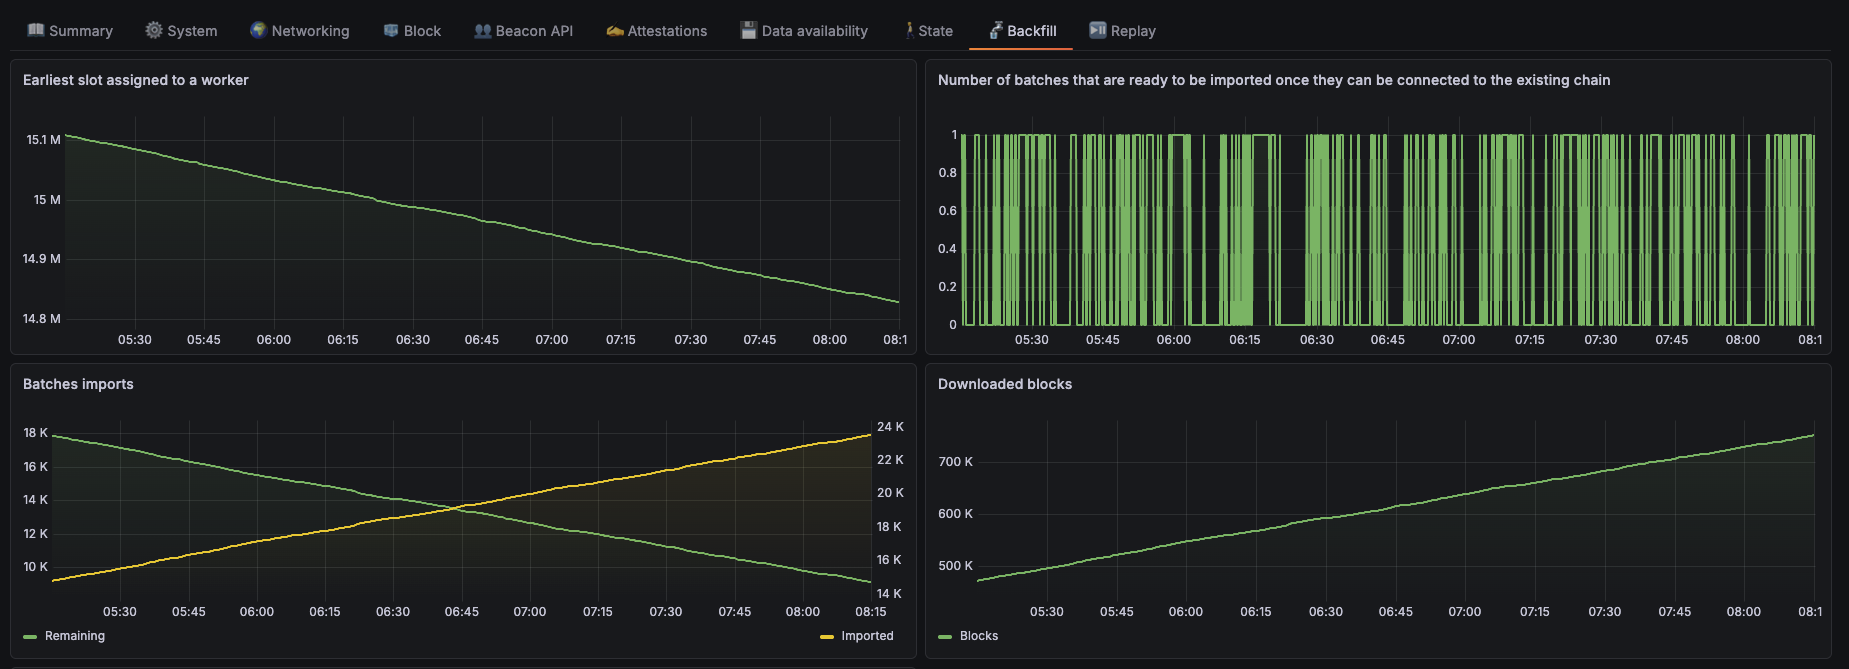
Backfill
Progress of downloading historical blocks and data column sidecars after a checkpoint sync.
Replay
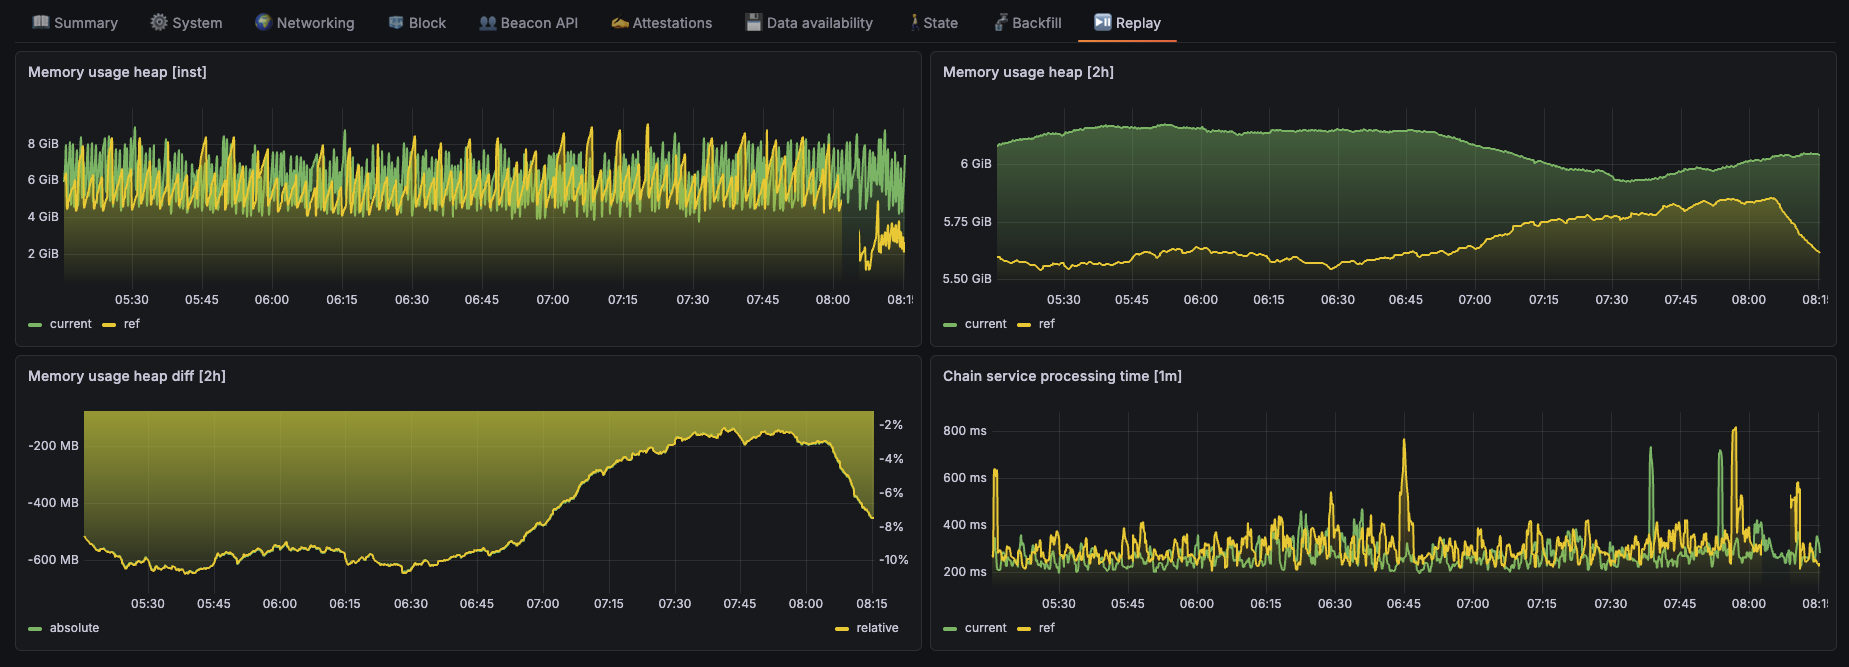
Heap memory and block processing time compared with the same series shifted back by the dashboard's Offset variable, for example, to compare before and after an upgrade.